In 30 days, build a data-analyst portfolio you can screen-share in the interview.
Eight real projects — a finished dashboard, a cleaned dataset, a working SQL schema — the exact things an interviewer asks to see. 90 minutes a day, every day mapped, the dataset and the worked answer already in the box.
Less than one of the ₹349 prep packs it's distilled from — read & plan on your phone, build on a laptop.
Whether you're a fresh graduate, switching in from another field, or stuck sending CVs with nothing built to show — if you can give 90 focused minutes a day, this was built for you. A plan you finish, not a course you forget.
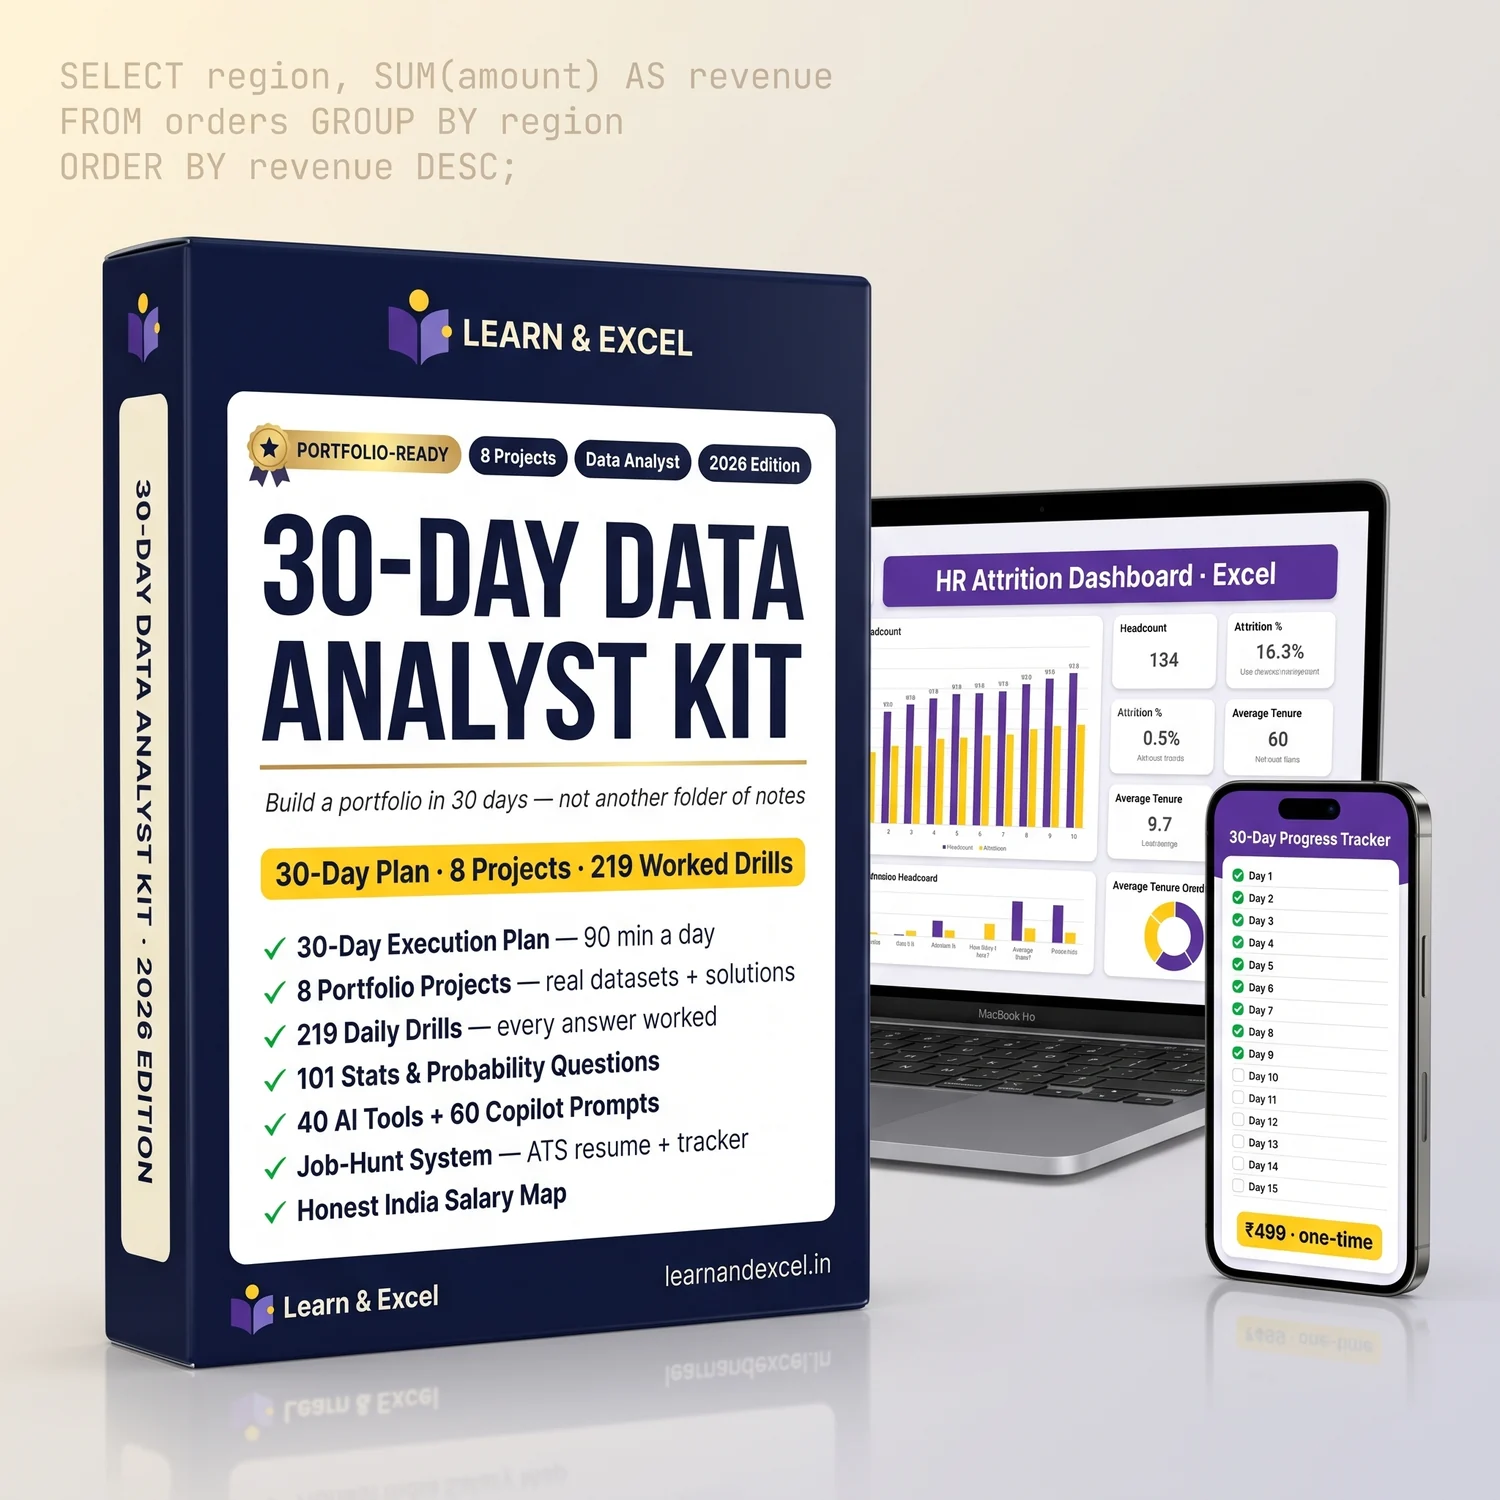
Everything in the kit — the plan, a real dashboard, 8 projects, the tracker. Real output, further down.
We could print a big “3,000+ placed” number here. We won't.
Because we can't prove a number like that to you — and you shouldn't trust a stranger who can't. The data-prep space is full of inflated “placed / ₹42 LPA” funnels. Here's only what we can prove, and what you can check yourself before you pay a rupee:
The drills are curated from our full SQL (₹349), Excel (₹349), Python (₹349) and Stats packs — every one a real, clickable product on this site.
Questions carry real company tags — Razorpay, Flipkart, TCS, Swiggy, JP Morgan and peers — from public JDs and interview reports, not partnerships.
Every number here — 219 drills, 8 projects, the row and page counts — is pulled by script from the built files. No padded “total value.”
You're probably one of these four. All four walk out with the same thing: a portfolio.
Not sure? If you can give 90 minutes a day, keep scrolling — the next 90 seconds will tell you.
Most funnels ask you to trust a number. We'd rather you check our work.
Here's one complete card from the daily-drill bank — the “revenue doubled overnight” drill, unedited, exactly as it ships. This is the format behind all 219 drills: the real question, the thinking out loud, the diagnosis, the fix, and the one line that makes you sound senior.
The scenario
You run a daily revenue report for a D2C brand. Yesterday it showed roughly ₹12 lakh, today it shows ₹24 lakh — but the founder swears nothing changed on the marketing side. The report query is below.
SELECT DATE(o.created_at) AS order_date,
       SUM(o.total_amount) AS revenue
FROM orders o
JOIN order_items oi ON oi.order_id = o.id
WHERE DATE(o.created_at) = CURRENT_DATE - INTERVAL '1 day'
GROUP BY DATE(o.created_at);
Thinking out loud
- “Anything that suddenly doubles points to a join multiplier, not a real revenue jump.”
- “orders is joined to order_items, but the SUM is on o.total_amount — an order-level column. Each order with two line items counts twice.”
- “Let me check the average line items per order — if it averages ~2 today, that explains the 2× perfectly.”
- “Confirmed: most orders today have 2 SKUs. The join is fan-out, the SUM is at the wrong grain.”
The diagnosis
Classic one-to-many join multiplier. orders.total_amount was summed at the line-item grain, so every additional line item duplicated the order total.
The one-line fix
SELECT DATE(created_at) AS order_date,
       SUM(total_amount) AS revenue
FROM orders
WHERE DATE(created_at) = CURRENT_DATE - INTERVAL '1 day'
GROUP BY DATE(created_at);“Anything that exactly doubles is almost never a real revenue jump — it's a join at the wrong grain. I'd check line-items-per-order before I touch the marketing data.”
Every one of the 219 drills reads exactly like this — the one sentence that separates a candidate who memorised an answer from one who understands it.
Try it 7 days — refund with one email, keep the files.
Not screenshots of a promise. Screenshots of the files you'll build.
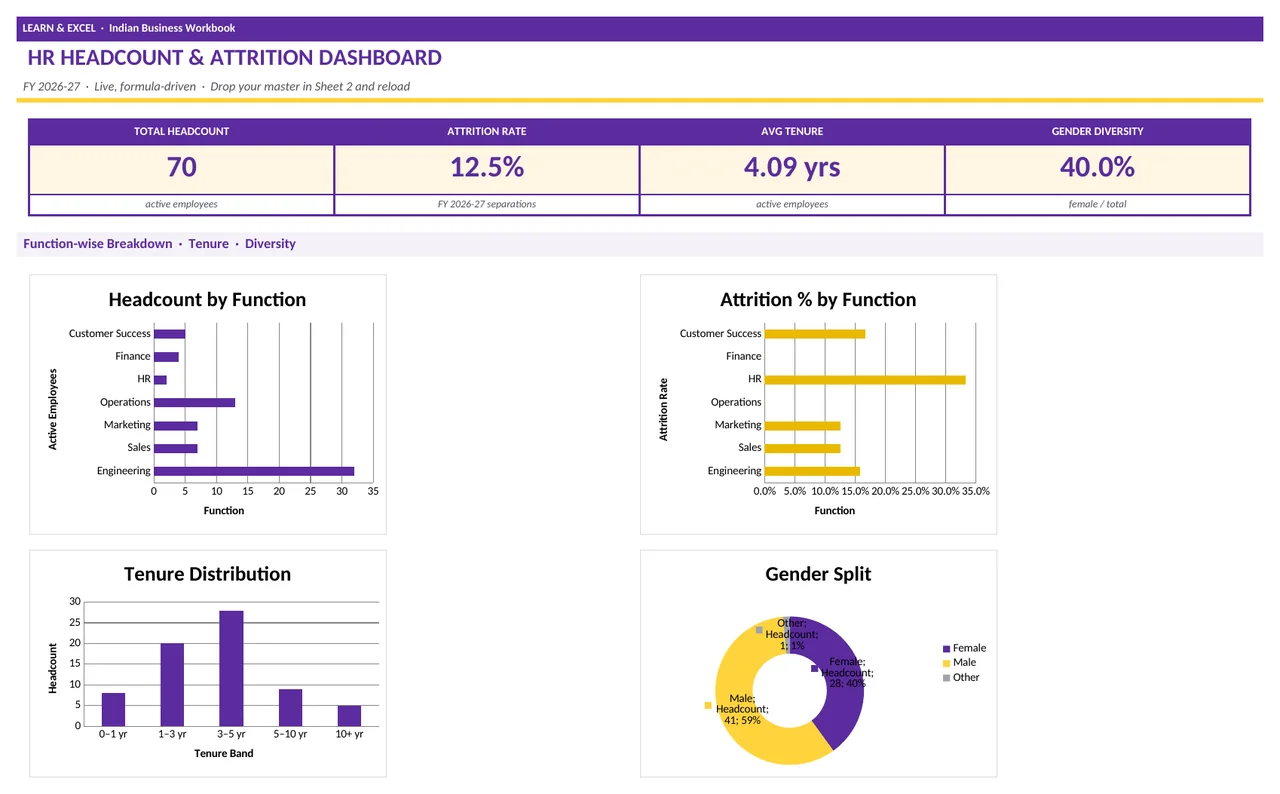
Built in Excel with live COUNTIFS / AVERAGEIFS — the kind you defend cell-by-cell. The worked solution surfaces 12.5% attrition on an 80-employee dataset.
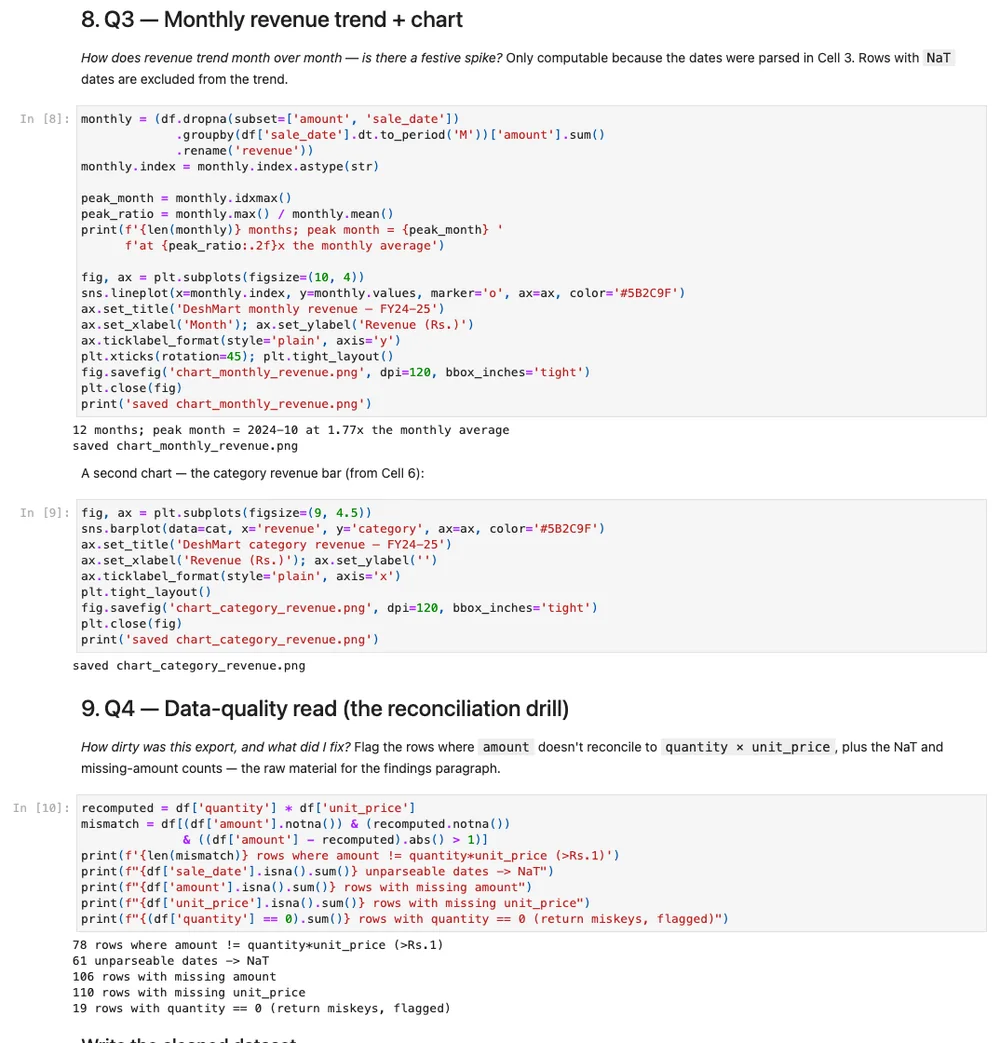
Load → clean → analyse a deliberately-messy 5,200-row export down to 5,000 clean rows, then ship the EDA. Real code, real output, runs top-to-bottom.
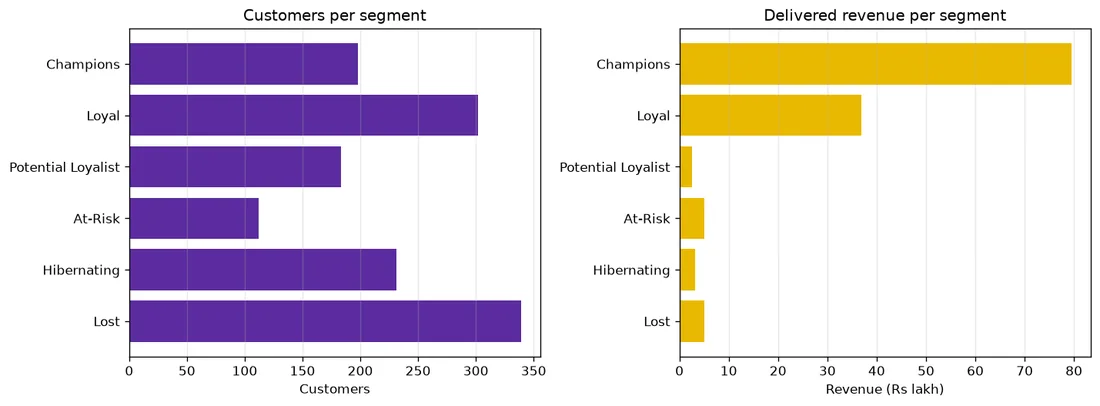
Real notebook output segmenting 2,000 customers across 12,000 orders. A genuine “senior-signal” portfolio piece, not a toy.
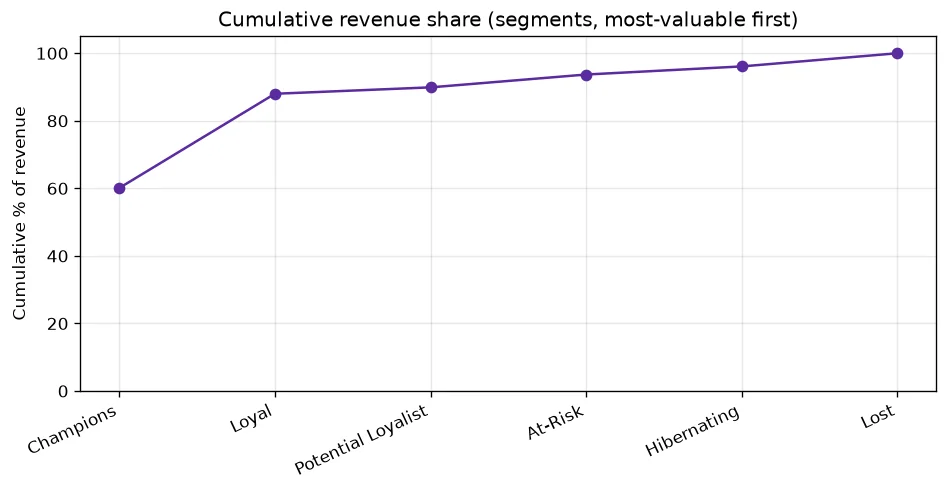
Which few categories actually drive the money — the 80/20 chart interviewers love to see you produce and interpret.
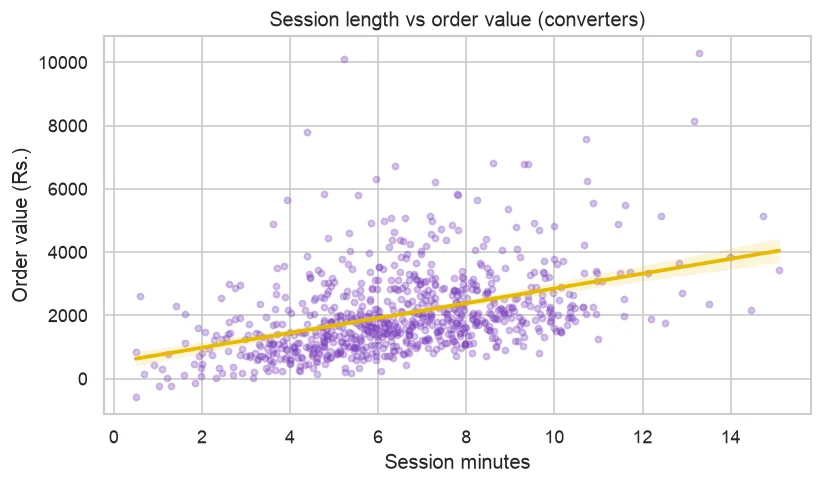
So you can defend the number, not just plot it — the maths, executed in a runnable notebook, not just described.
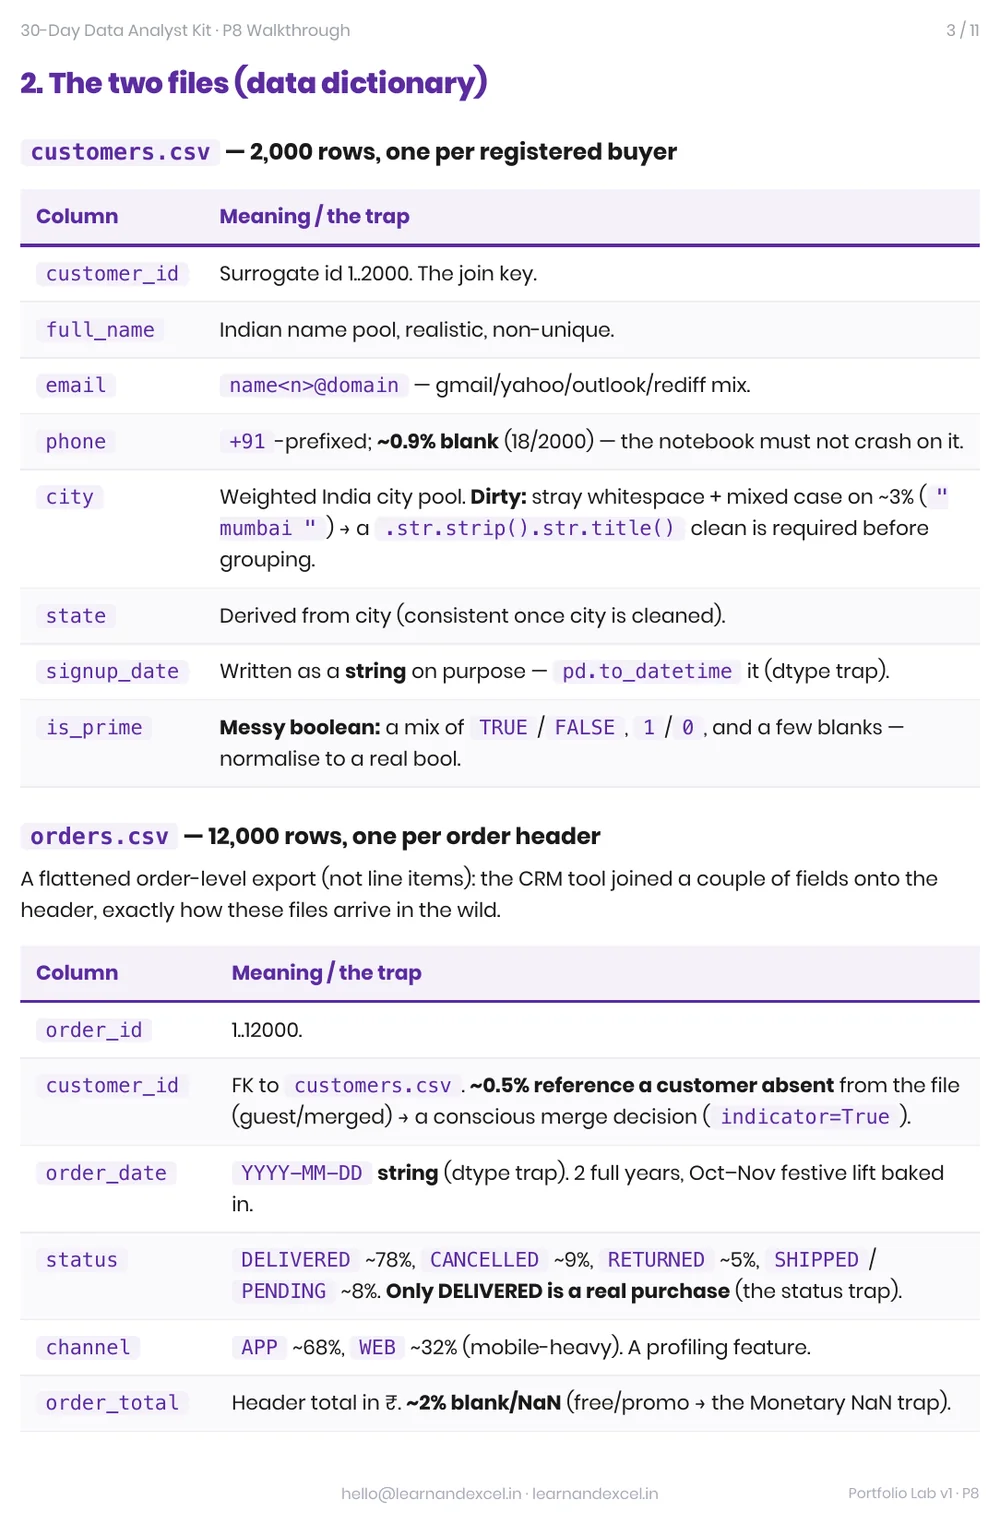
Every project ships an 8–12 page walkthrough that solves it with you — the reasoning, the query, the traps, step by step.
QUESTIONS & DIFFICULTY MODELLED ON PUBLICLY REPORTED INTERVIEWS AT — (from public JDs & interview reports, not partnerships)
Honestly counted. Every number here was pulled from the actual files.
Not a 300-item dump — a curated 30-day path where every item has a job.
90 minutes a day, Learn → Do → Ship a real artifact, every day, with a checkbox. 15-page plan, 4 weekly self-check gates, catch-up days built in so one bad week doesn't kill the streak.
Each ships a real dataset + a worked reference solution + a rubric + a “present it” page (the resume bullet, a 60-second walkthrough, and the follow-up answers).
The curated question set for each of the 20 drill days — every single one with the full worked answer printed right below it. Not a question list; a practice bank. (325-page index.)
The Stats Crack Pack: p-values, error types, A/B sizing, correlation-vs-causation — the round where candidates get exposed, worked end to end. 75 pages + a runnable notebook.
A 40-tool AI toolkit (hand-checked, no dead links) and 60 four-part AI-copilot prompts you paste to work faster — the modern analyst's edge, honestly framed.
ATS-clean resume templates, an application-tracker .xlsx, recruiter & referral outreach scripts, a where-to-apply map, and a runnable Python job-scraper starter — done for you.
Also inside: a printable progress tracker (.xlsx + wall PDF), the BI Starter (guided Power BI + Tableau on a no-paid-tool Excel path), and the Honest Career Map.
You studied for weeks. Could you answer these out loud, today?
Three real questions from inside the kit, at the difficulty an interviewer actually uses.
Your daily revenue report showed ~₹12 lakh yesterday and ~₹24 lakh today — but nothing changed in marketing, traffic, or ad spend. The query joins orders to order_items and SUMs orders.total_amount. Why did revenue exactly double, and what's the one-line fix?
If you can't name the join multiplier in ten seconds, you'll ship a doubled number to a founder one day.
pandas has three ways to say “missing” — np.nan, None and pd.NA. What's the difference, when does each show up — and why does one missing cell quietly turn your integer user-ids into 1.0, 2.0, 3.0?
Every real dataset is dirty. If you can't explain why your ids went float, you can't clean it.
A family has two children; at least one is a girl. What's the probability that both are girls? (If you said 1/2 — are you sure?)
It's 1/3, and the reasoning is what they're testing. Most people answer 1/2 and can't say why it's wrong.
Blank on all three? That's not a sign you're too far behind — it's the exact starting line this kit is built for. Nailed all three? You're closer than you think; the kit is your reps and your proof. Either way, here's where it actually breaks:
- ✕You have the degree and the certificates — but a listing says “portfolio required,” you realise you have nothing built to attach, and you don't even apply.
- ✕You finished the SQL playlists — then the live round asked you to write a running total on a schema you'd never seen, and your mind went blank.
- ✕You got the take-home CSV — dupes, three date formats, ₹-strings — realised you'd never actually cleaned real data, and couldn't finish it.
- ✕“Show me a project” — and you had certificates and a playlist. Nothing you could screen-share. Nothing that survived one follow-up question.
- ✕The interviewer asked “why is this dashboard misleading?” and you could name every chart type but couldn't read the trap.
None of that is a talent problem. It's a reps problem — you were never handed the data to build on, the query to study, and the worked answer to check yourself against. That's the entire design of the next 30 days: you don't watch, you build, and you finish the month with things you can show.
Eight recruiter-ready projects. Real datasets, worked solutions, a “present it” page each.
Every project ships the three things a “use any dataset you like” brief never gives you — the dataset to run, the worked solution to check against, and a rubric — plus a page that hands you the resume bullet, the 60-second walkthrough, and the interview follow-up answers.
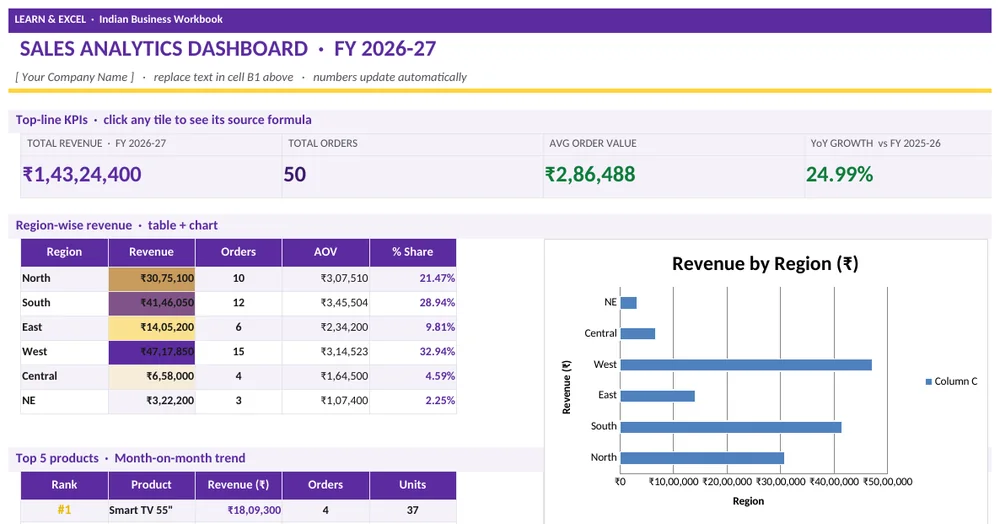
You can say: “I built a live KPI dashboard that surfaces ₹1.43 Cr in revenue by region and category.”
You can say: “I found the 12.5% attrition driver with COUNTIFS / SUMPRODUCT — no pivot tables, all defensible.”
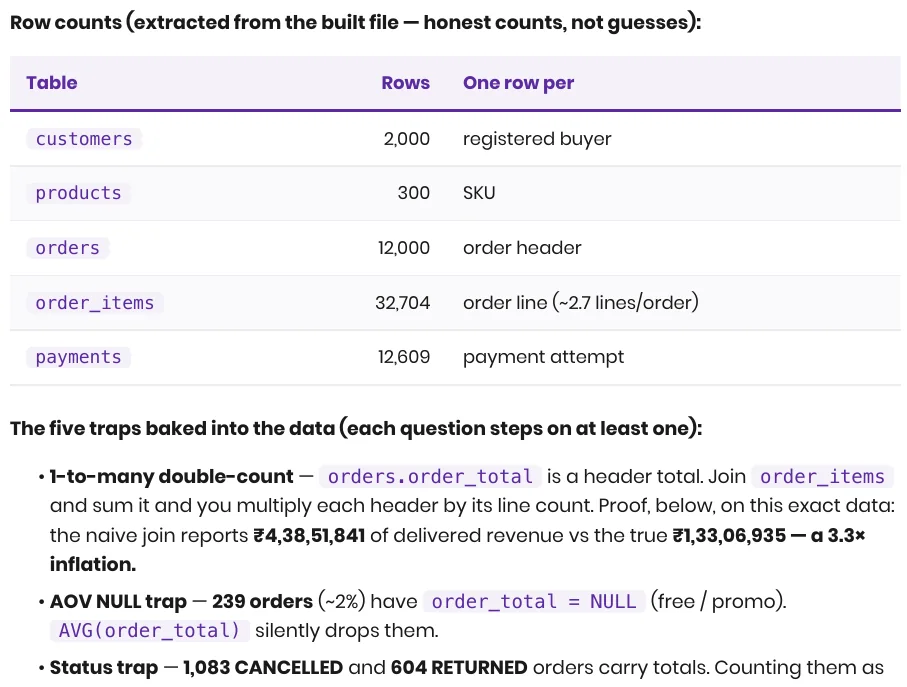
You can say: “I wrote the joins and found a 36.5% repeat-purchase rate on a real schema.”
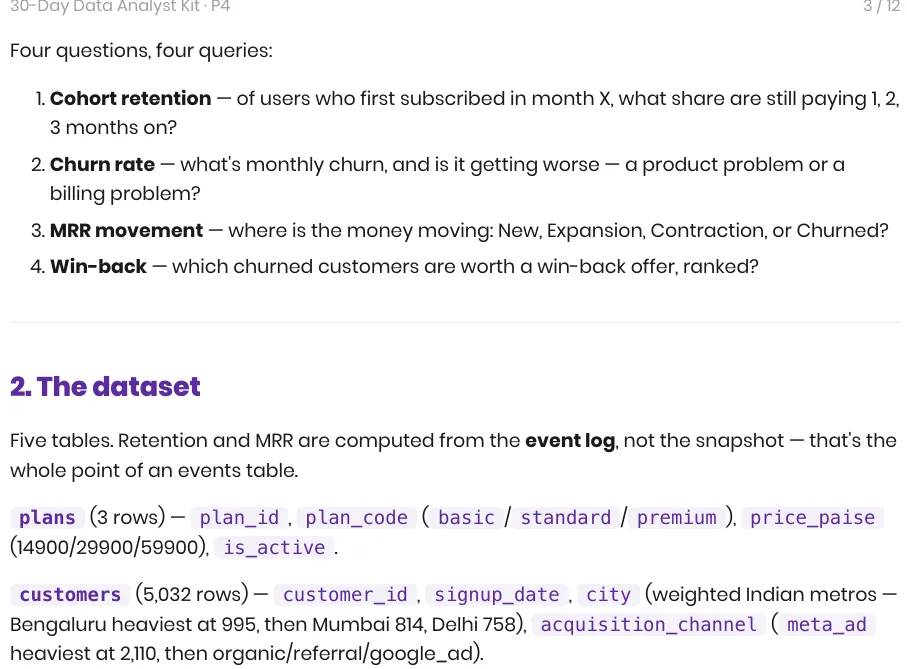
You can say: “I built a retention-cohort grid and defined active-vs-churned in SQL.”
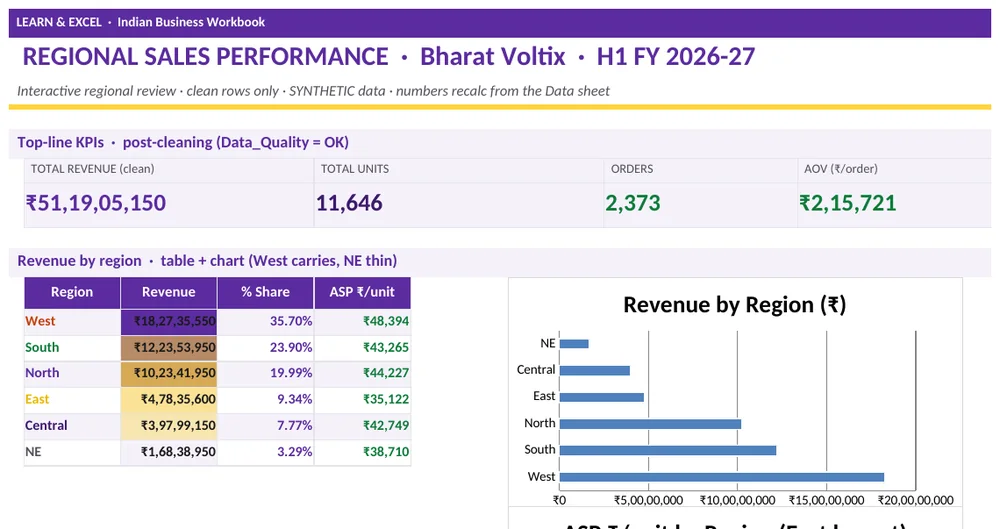
You can say: “I built a regional sales view — with a guided no-paid-tool Excel path.”
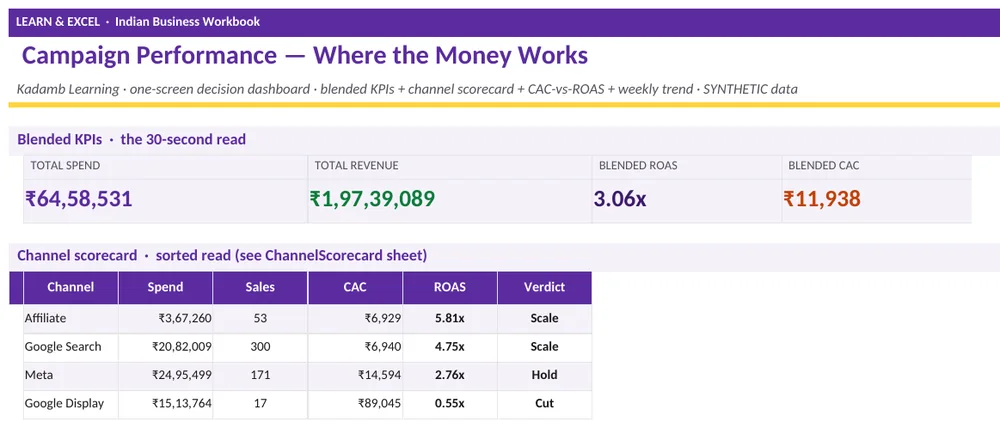
You can say: “I read a marketing funnel and flagged the weak campaigns.”
You can say: “I cleaned a genuinely dirty export and shipped an EDA notebook that runs top-to-bottom.”
You can say: “I segmented customers with RFM and k-means — a senior-signal piece.”
Seen enough? The whole kit is ₹499, once.
The 30-day plan, all 8 projects, 219 worked drills, the stats pack and the job-hunt system — one price, no subscription, 7-day refund with one email.
A full month, a fortnight, or an interview this week — there's a path.
Run the plan as designed: 90 minutes a day, ship all 8 projects, finish Week 4 with a resume and a live application tracker.
Skip to the Portfolio Lab and build the 4 strongest pieces (P2, P3, P7, P8), use the “present it” pages, and walk in with real artifacts.
Hit the drill bank for your weak round (SQL Day 8–10, pandas Day 16, stats), rehearse the 30-second scripts out loud, grab one finished dashboard to screen-share.
You can find the pieces free. You can't find them assembled.
Everything below, for one honest price.
- ✓The 30-Day Execution Plan (15pp · 6 ship-days · 4 weekly gates · catch-up days)
- ✓8 recruiter-ready portfolio projects — real dataset + worked solution + rubric + “present it” page each
- ✓219 curated interview drills, every answer worked (325-page index)
- ✓101 Stats & Probability questions worked end-to-end (75pp) + a runnable notebook
- ✓A 40-tool AI toolkit + 60 four-part AI-copilot prompts
- ✓The Job-Hunt System — ATS resume, application-tracker .xlsx, outreach scripts, job-scraper starter
- ✓The Honest Career Map (real India salary bands — ranges, not a promise)
- ✓The Progress Tracker (.xlsx + a printable wall PDF) + the BI Starter (guided Power BI + Tableau on a no-paid-tool Excel path)
- ✓2026 edition + free updates to this edition
The full prep packs these drills come from aren't free to buy on their own: SQL ₹349 + Excel ₹349 + Python ₹349 + the Brightstep Jobs Toolkit ₹249 — that's ₹1,296 for those four alone, before the 30-day plan, the 8 projects, or the stats pack. The kit distils the interview-critical parts of all of it into one path for ₹499.
Every price above is a live product on this site — click any of them and check.
The 30-day plan, 8 projects, 219 worked drills, the stats pack and the job-hunt system. Most people start here.
The Kit plus the complete SQL, Excel and Python prep libraries and the Brightstep Jobs Toolkit, in full. Those five separately are ₹1,795 — you save ₹596. It's just the cheaper way in if you already know you want the full libraries — an option at checkout, never required.
Weak on one round? At checkout you can add the complete ₹349 SQL or Excel pack for ₹199 — your call, not required.
- Pay ₹499 by UPI or card (Razorpay).
- Get the Drive folder link instantly — on-screen and by email.
- Open the plan on your phone, build on a laptop. No account, no subscription, no auto-renew.
- ✓You froze on a live SQL round despite finishing the playlists.
- ✓You have certificates but nothing you can screen-share.
- ✓You've never actually cleaned a dirty, real-world dataset.
- ✓You can give ~90 focused minutes a day for a month.
This isn't for everyone — including who should not buy.
- ✓You're a graduate or early-career switcher who can give ~90 focused minutes a day for a month.
- ✓You learn by doing, and you're tired of watching videos that don't stick.
- ✓You have little or nothing to show — no portfolio, no built artifacts — and you need real ones.
- ✓You want to walk in able to answer out loud, not just recognise the answer.
- ✕You've never opened a spreadsheet and want zero daily effort — this is a build plan, not magic.
- ✕You want a job or salary guarantee — nobody honest can give you one, and we won't pretend to.
- ✕You already have 3+ years of analyst experience — you've outgrown the map.
- ✕You want 300 titles to skim — this is 8 projects done properly, not a box you never open.
The real India salary bands — a number to defend, not a number we promise.
Market ranges, not a promise. Every number below is a market range from public salary signals (Levels.fyi India, AmbitionBox, Glassdoor India), not a guarantee of what you will earn. The ₹42 LPA figure some kits wave at freshers is a top-outlier — a senior 8+-year number — not a starting line. As a fresh Day-30 finisher, read your realistic fresher band below.
This kit builds the proof and the pipeline — it cannot build the offer. What it does is stop you walking into a salary conversation anchored on a poster instead of your real band.
This kit is new — so we'd rather show you the work than borrow a stranger's quote.
Plenty of pages in this space are wallpapered with named testimonials and company logos. We won't post reviews we can't stand behind. Instead, everything you'd want a reviewer to vouch for, we've already put in front of you to check yourself — a full worked drill given away above, real screenshots of every deliverable, and a 7-day refund if it isn't what we said. When we have genuine reviews to share, they'll go right here — with a real first name and city, and never a made-up “I got placed at ₹X” line.
The 7-day, no-forms, keep-the-files guarantee.
Buy it, open it, use it. If within 7 days it isn't for you, email us the single word “refund” and it's done. No 30-day-completion clause, no “prove you tried” screenshots, no reply-and-negotiate. You get every rupee back, and you keep the files. We'd rather lose ₹499 than have your money sitting somewhere you regret — that's the whole deal.
Questions people ask before they buy.
Who are you, and why should I trust Learn & Excel?
We're a small India-focused team that builds interview-prep for analysts, developers and finance folks. This kit's drills are curated from our own full SQL, Excel, Python and stats packs — all live, clickable products on this site. We don't claim buyer counts or placement stats — we let the free worked sample above and the 7-day refund do the talking. If it isn't worth ₹499, email “refund” and get every rupee back.
Exactly what do I download, and does everything open on my phone?
A Drive folder, delivered by a PDF link. Inside: PDFs (the plan, walkthroughs, career map), Excel .xlsx files (dashboards, tracker), .sql schema files, .ipynb Jupyter notebooks, and .csv datasets. The plan, drills and career map read and work fully on your phone; the Excel / SQL / notebook build files are best on a laptop when you sit down for the 90 minutes. So: read and plan on your phone, build on a computer.
Is this just a rehashed PDF I could Google?
No. It's real files you open and run: 8 .xlsx dashboards, .sql schemas on a real 5-table database, runnable .ipynb notebooks, .csv datasets — plus the PDF plan and walkthroughs. The screenshots on this page are those actual deliverables, not stock images.
Is my payment safe? How do you take payment?
Razorpay handles the payment — the same gateway behind major Indian brands. UPI, cards, and net-banking all work. We never see your card details.
Will I get charged again — is this a subscription?
No. One payment of ₹499, no renewal, no auto-debit. The checkout add-ons (a single prep pack, or the Everything bundle) are optional and clearly priced — never a trap.
Do I need to buy any paid tools?
No. The two BI projects (Power BI, Tableau) ship a guided no-paid-tool Excel fallback, so you can complete all 8 projects without buying anything. Free tools (Excel or Sheets, Postgres or SQLite, Jupyter) cover the rest.
I'm a beginner — is this too advanced?
If you've opened a spreadsheet and can commit 90 minutes a day, you're the target reader. Week 1 starts at Excel + basic SELECT / JOIN and builds up. It's not for absolute-zero “never touched a computer,” but it is built for early-career and switchers.
Will I actually finish it?
It's built around that exact fear. 90 minutes a day, a checkbox every day, catch-up days on 7, 14, 21 and 28 so a bad week doesn't kill the streak, and 4 weekly self-check gates. A plan you finish beats a plan that impresses you on Day 1 and dies by Day 9.
Is this a job guarantee?
No, and be wary of anyone who promises one. This builds the proof (8 projects) and the pipeline (resume, tracker, outreach). The offer depends on you, the market, and the reps you keep after Day 30. The salary bands in the kit are ranges, not promises.
What if I buy and it's just not what I expected?
7 days, no questions. Email us the single word “refund,” keep the files, get your ₹499 back. No completion clause, no “prove you tried” screenshots.
Thirty days from now, you'll either have a portfolio — or another month of “I'll start Monday.”
One is a folder of finished projects, a dashboard you can screen-share, and 219 answers you can actually say out loud. The other is where you are today. The kit is ₹499, once. The 90 minutes a day is on you.
Razorpay-secured checkout · UPI · Cards · Net Banking · 7-day refund · Instant Drive delivery
Learn & Excel — 30-Day Data Analyst Kit, 2026 edition. Question difficulty and company tags reflect publicly reported interview experiences; datasets are synthetic-but-realistic and labelled as such — none are any employer's production data. Salary bands are market ranges aggregated from public sources (Levels.fyi India, AmbitionBox, Glassdoor India), not guarantees. This kit is a study-and-build program. It is not a promise of a job, placement, internship, or any specific salary. Outcomes depend on your effort, the market, and factors outside our control. 7-day refund on every purchase.